Power Line & Wind Turbine Study

Power Line & Wind Turbine Study
Purpose
Olson Engineering conducted an engineering geophysics investigation in the midwest to determine shear-wave velocity profiles (Vs) for the soils and bedrock across 4.2 miles of proposed wind turbine transmission lines.
Objective
Determine depth to bedrock and provide 2-D bedrock characterization plots for conducted lines to aid in foundation design.
Method
The objectives were met using active multi-channel analysis of surface waves (MASW) plus seismic refraction tomography (SRT) for the wind turbine sites.
Data Acquistion
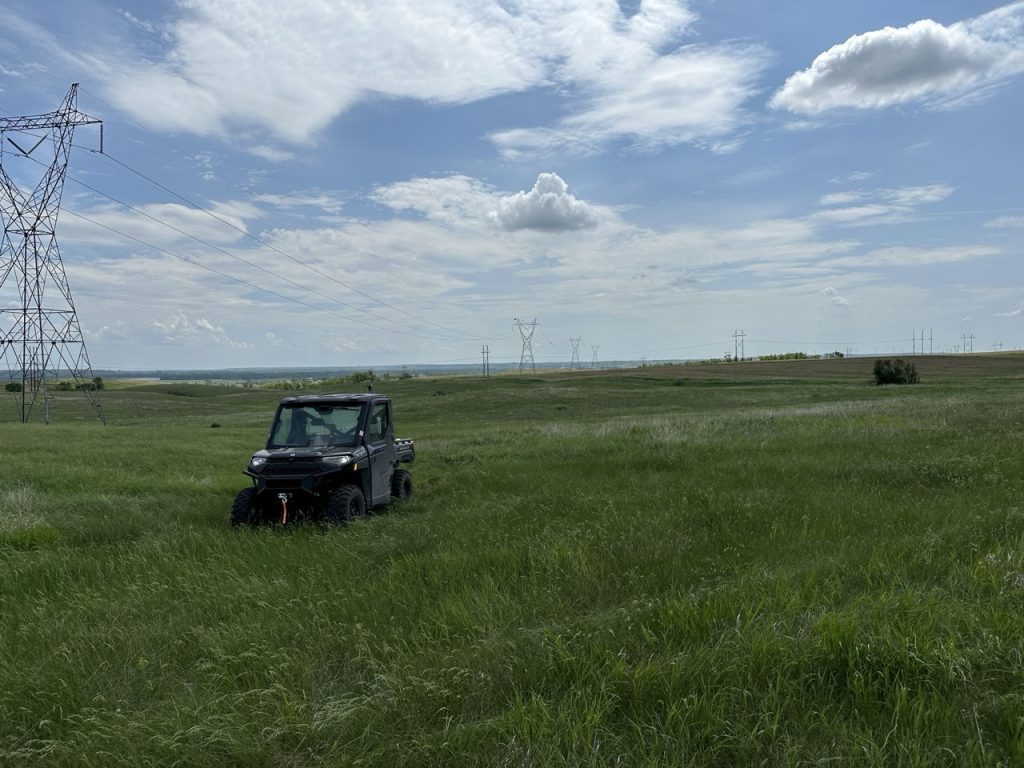
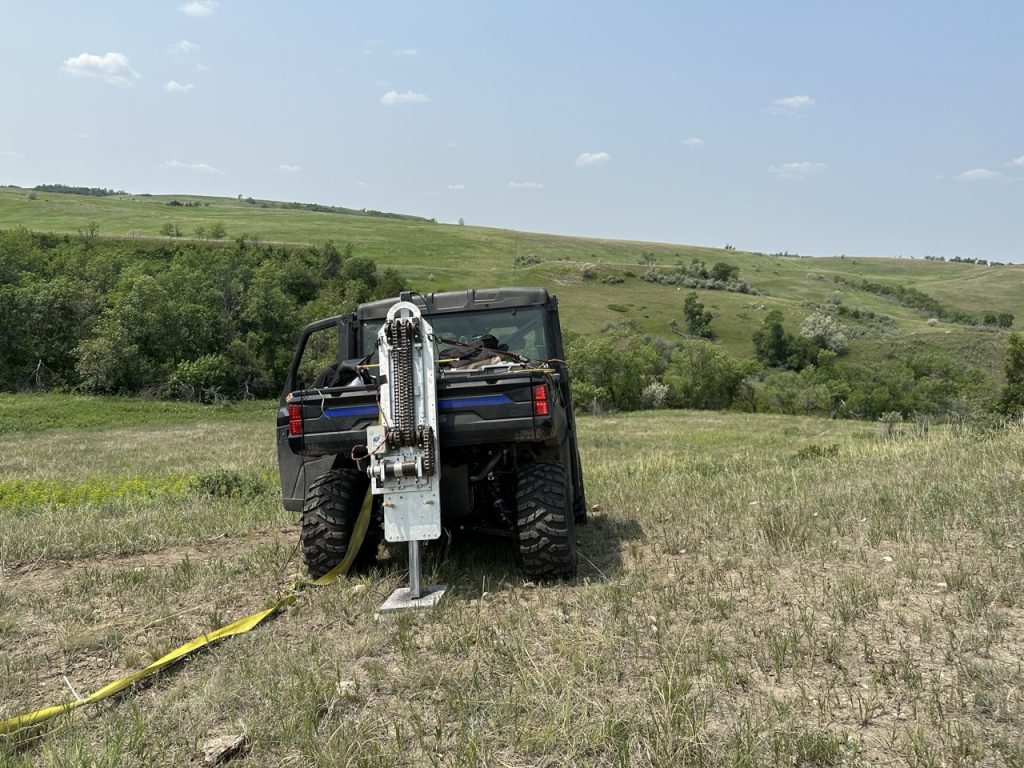
Two person crews completed the field work over two weeks. Data was collected with a 24-channel seismograph with 24 4.5Hz geophones mounted to a land-streamer cable. The active source was an 80-lb. accelerated weight drop (AWD) and the geophones were spaced at 6 feet apart. The land-streamer cable and AWD were mounted to a Utility Terrain Vehicle (UTV) to conduct the remote lines.
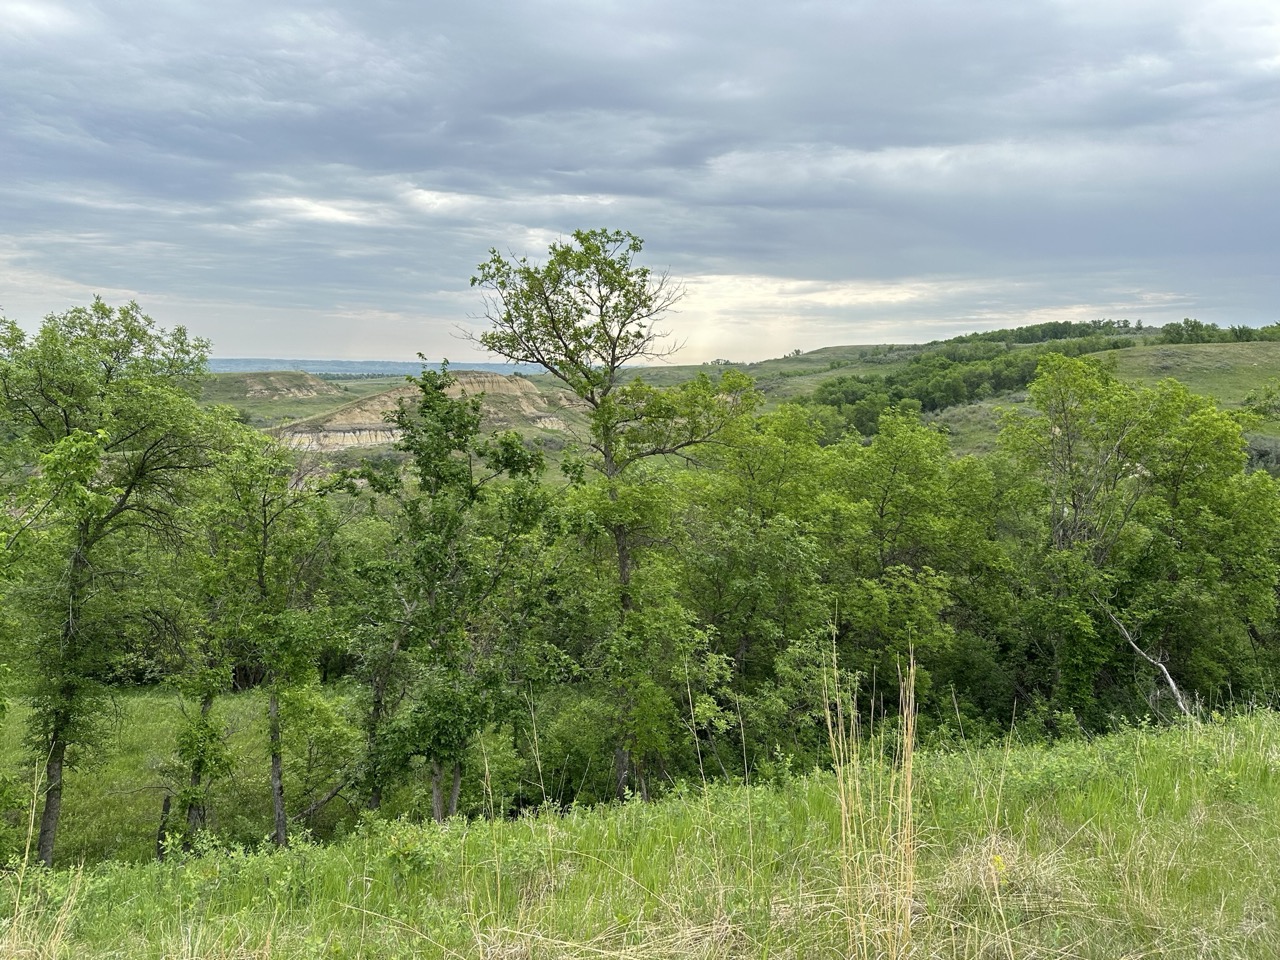
Line locations were recorded with a RTK GPR unit, and a total of 29 lines made up the total 4.2 miles surveyed. Steep terrain and large dense patches of trees prevented the survey from being one continuous line. Due to important American history throughout this area, avoidance zones were also provided to preserve potential native American artifacts. Due to this, Olson was accompanied in the field to ensure the preservation of these areas.
Interpretation
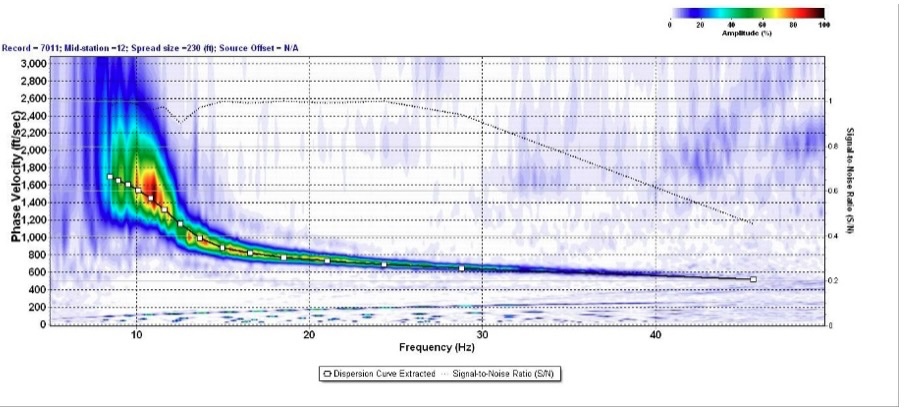
Multi-Channel Analysis of Surface Waves (MASW): Active and passive MASW analysis consists of generating a frequency-velocity transform from the surface waves, picking the transformed data to derive a dispersion curve, and inverting this dispersion curve to a layered Vs model. The figure shown here illustrates and example of the typical dispersion curve picking approach used for MASW soundings. These steps are repeated for each test line using all 24 geophone recordings at a time, resulting in a one-dimensional (1D) S-wave velocity (Vs) sounding.
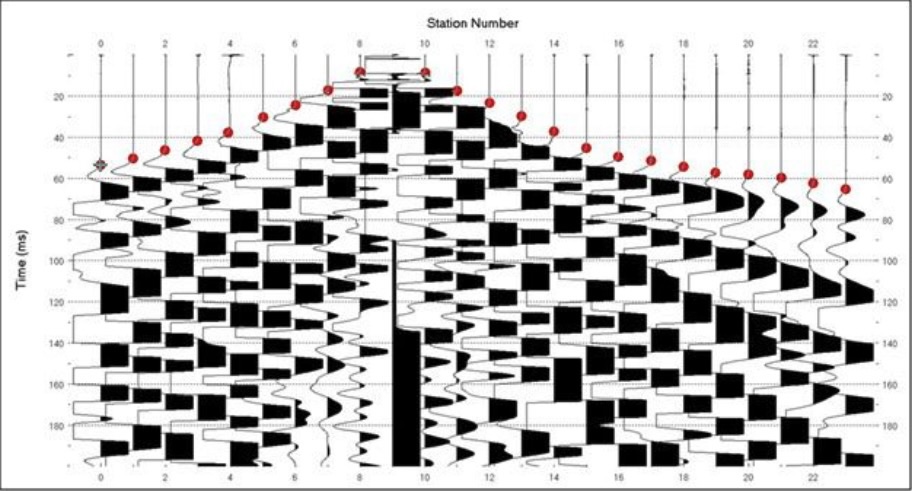
Seismic Refraction Tomography (SRT): The two major processing steps involved with SRT are first arrival picking and data inversion. The first arrival picking step consists of picking the time for each trace (signal) where the first-arrival of wave energy is observed at the geophone position. The figure shown here illustrates the typical picking approach used for SRT records. After picking is completed, a two-dimensional (2D) P-wave velocity (Vp) model is generated that best fits the first arrival picks.
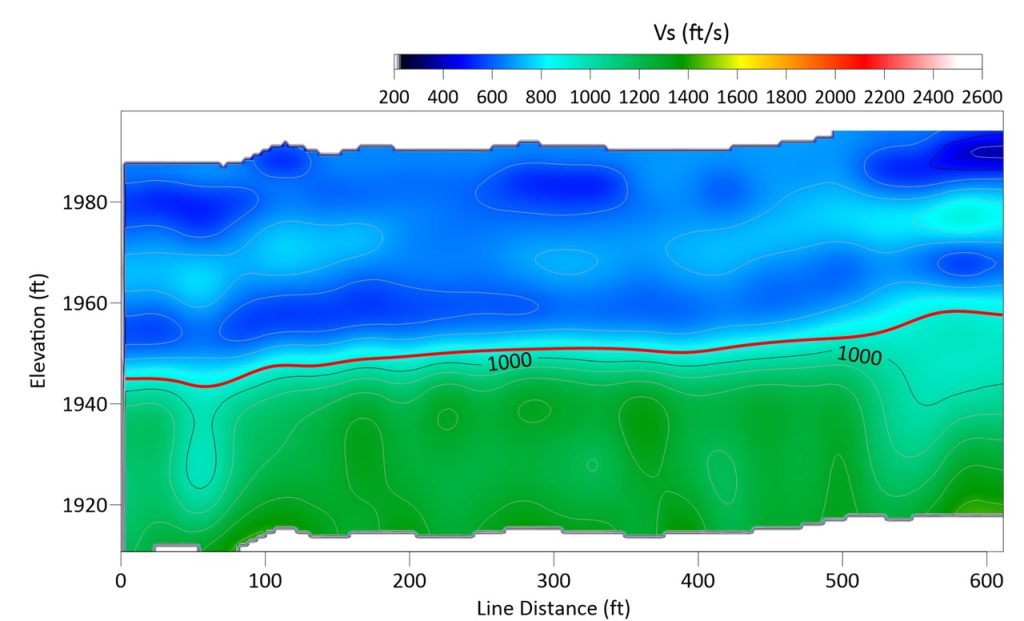
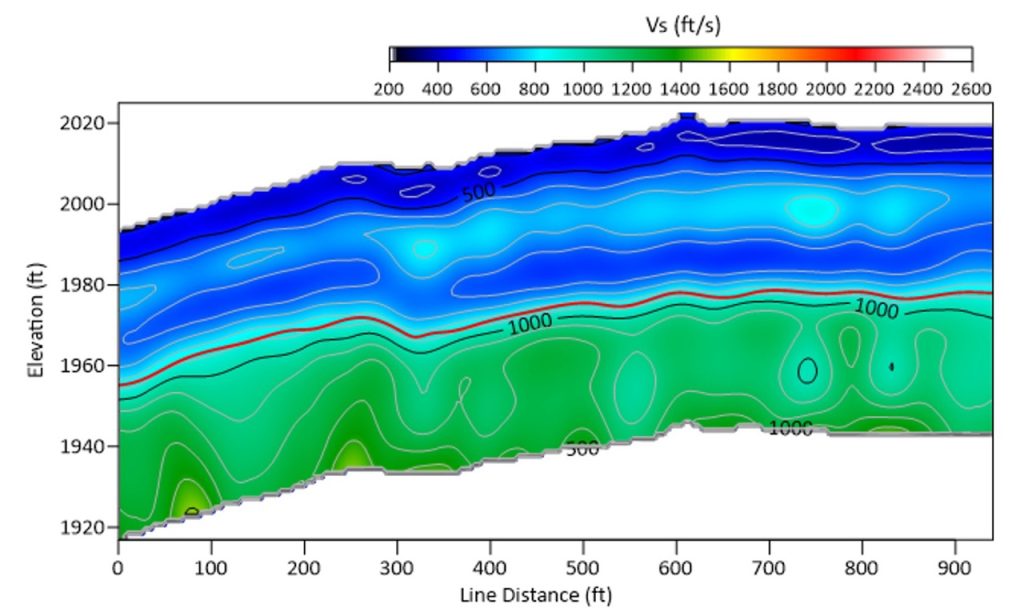
Results
Typical 2-D Shear-wave velocity (Vs) profiles are displayed below with ‘cool’ colors (e.g., blue) representing lower velocity values associated with less dense materials and ‘warm’ colors (e.g., red) representing higher velocity values associated with more dense materials. Weathered bedrock can be considered to be below the red line located just above the 1,000 ft/s contour.