Pavement Sinkhole Investigation

Pavement Sinkhole Investigation
Purpose
Olson Engineering conducted geophysics investigations in Colorado to examine stability of an area around a recently backfilled sinkhole over asphalt pavement.
Objective
To check for further void areas around the sinkhole, and examine the quality of the fill material placed in regards to filling the void space.
Method
The objective was met by using a combination of MASW and GPR. MASW was collected via plate geophones as the survey was conducted on the asphalt pavement.
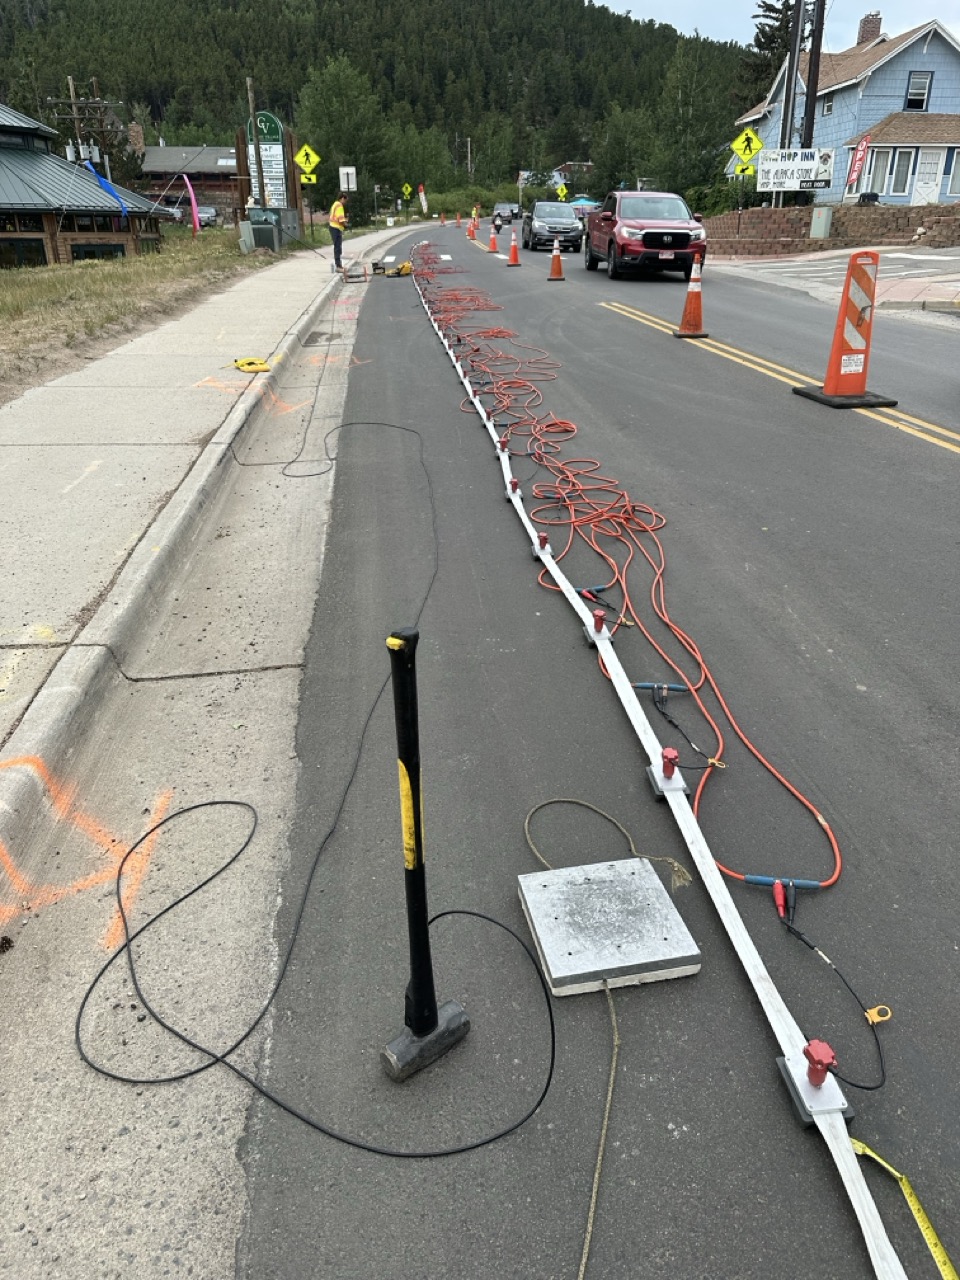
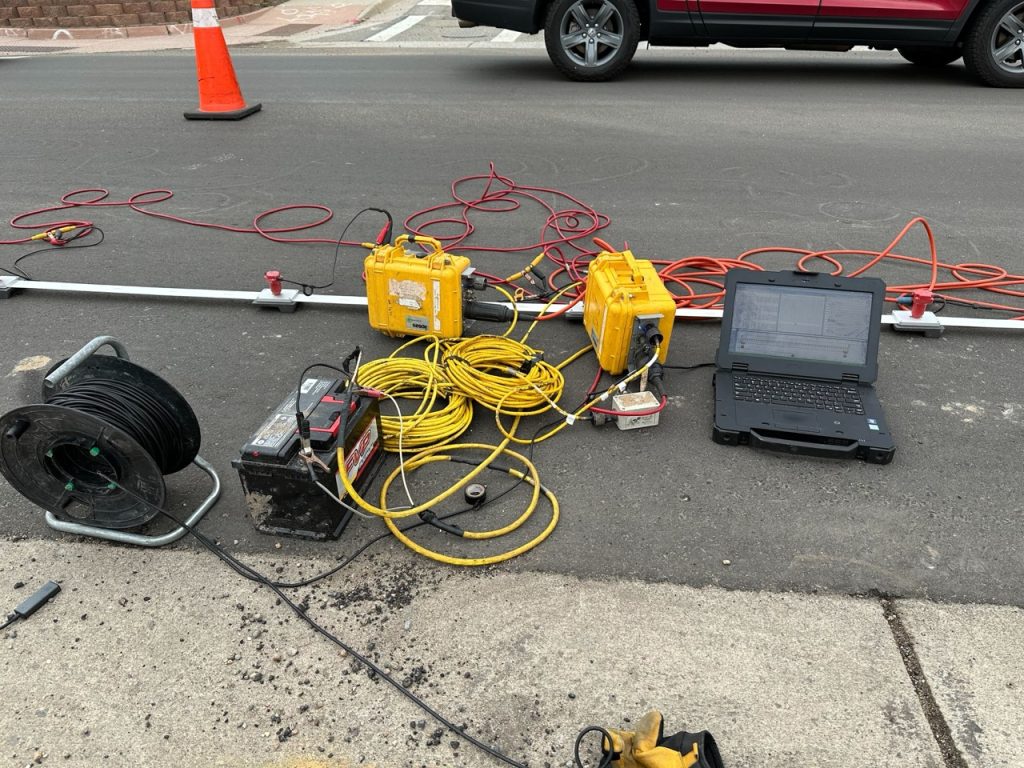
A two-person crew completed the field work in one day. MASW data was collected using two 24-channel seismographs with 48 total 4.5 Hz geophones mounted to plates at a 3-foot interval. Two 210’ lines were conducted, one in each lane of travel. 4 parallel GPR lines were conducted across each lane of travel, with perpendicular lines spaced approximately every 10 feet. All lines for both MASW and GPR were recorded with an Emlid RTK GPS system.
Active MASW was acquired using a 16-lb. sledgehammer impacting a plate. Shot points were located every 9 feet, beginning 18 feet off the ends of the lines. One “roll-along” was completed for each seismic line in order to cover the entire area of interest.
Interpretation
Multi-Channel Analysis of Surface Waves (MASW): Active and passive MASW analysis consists of generating a frequency-velocity transform from the surface waves, picking the transformed data to derive a dispersion curve, and inverting this dispersion curve to a layered Vs model. The figure shown here illustrates and example of the typical dispersion curve picking approach used for MASW soundings. These steps are repeated for each test line using all 24 geophone recordings at a time, resulting in a one-dimensional (1D) S-wave velocity (Vs) sounding.
Ground Penetrating Radar (GPR): The GPR method involves moving an antenna across a test surface while periodically sending pulsed waveforms from the antenna and recording the received echoes. These electromagnetic wave pulses propagate through the material directly under the antenna, with some energy reflecting back whenever the wave encounters a change in electrical impedance, such as at a section of rebar or other steel embedment or asphalt/subgrade interface. The antenna then receives these echoes, which are amplified and filtered in the GPR computer, and then digitized and stored. A distance wheel records scan distance across the test surface and embedded features can be located at a given distance from the scan start position.
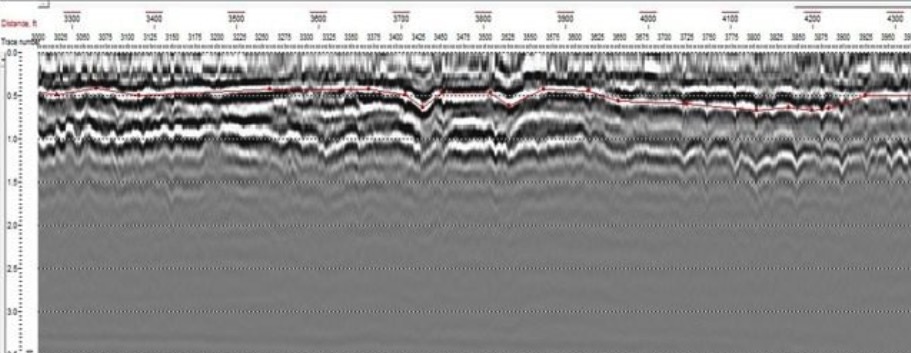
The resulting raw data is in the form of echo amplitude versus time. By inputting the dielectric constant, which defines the material velocity, and by estimating the signal zero point, the echo time data can be converted to echo depth. The scans are then typically plotted as two-dimensional (2D) waterfall plots of all of the individual data traces collected, with the lightness or darkness of each point in the plot being set by the amplitude and polarity (positive or negative) of the data at a given depth in each trace.
Results
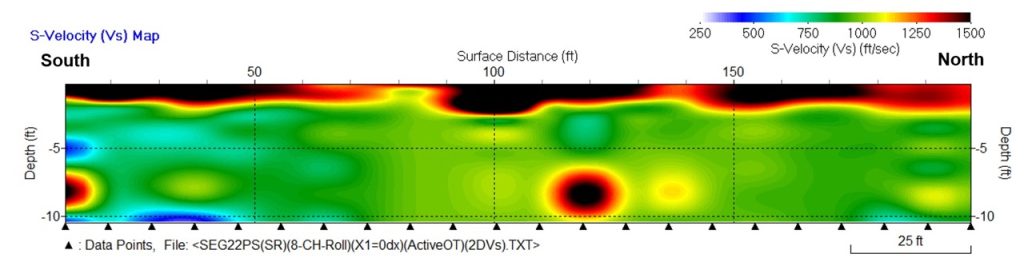
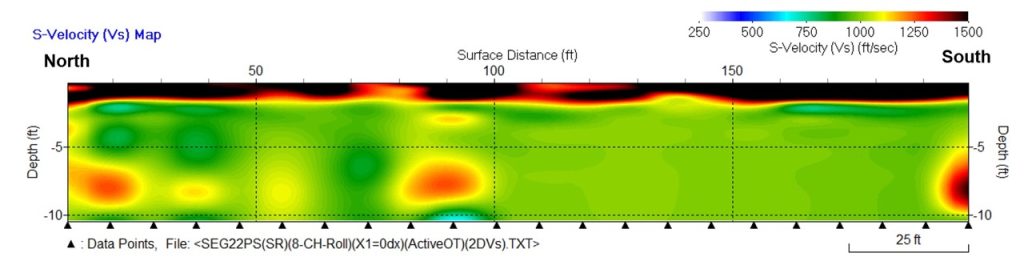
2-D MASW results can be seen below. The fastest velocities at the surface of each line show the asphalt layer before the subgrade. For a void investigation we are looking for areas of low velocity that may correlate to less compacted zones from fluid flow. There are no responses seen consistent with this, so the MASW data doesn’t identify any areas of concern.
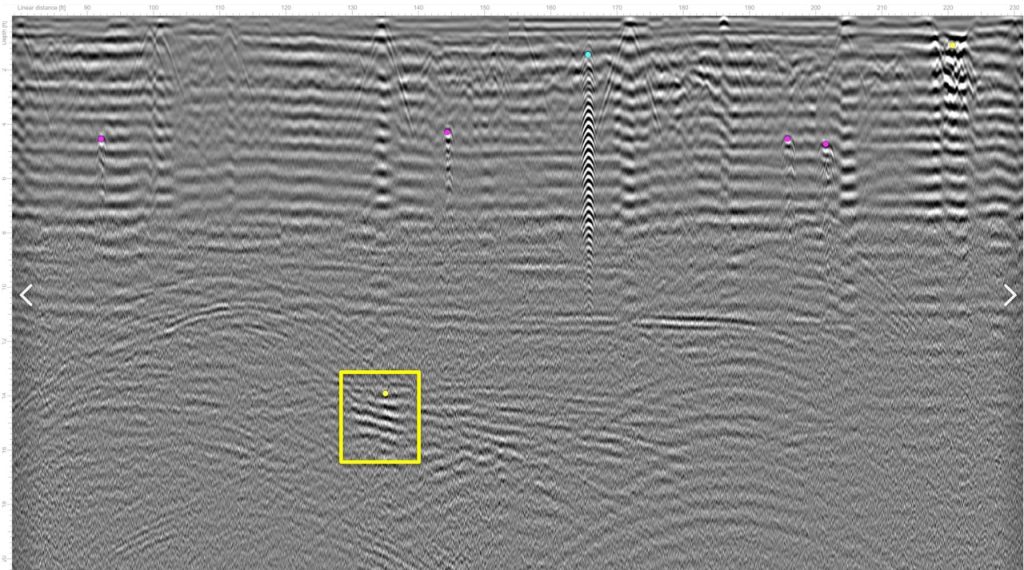
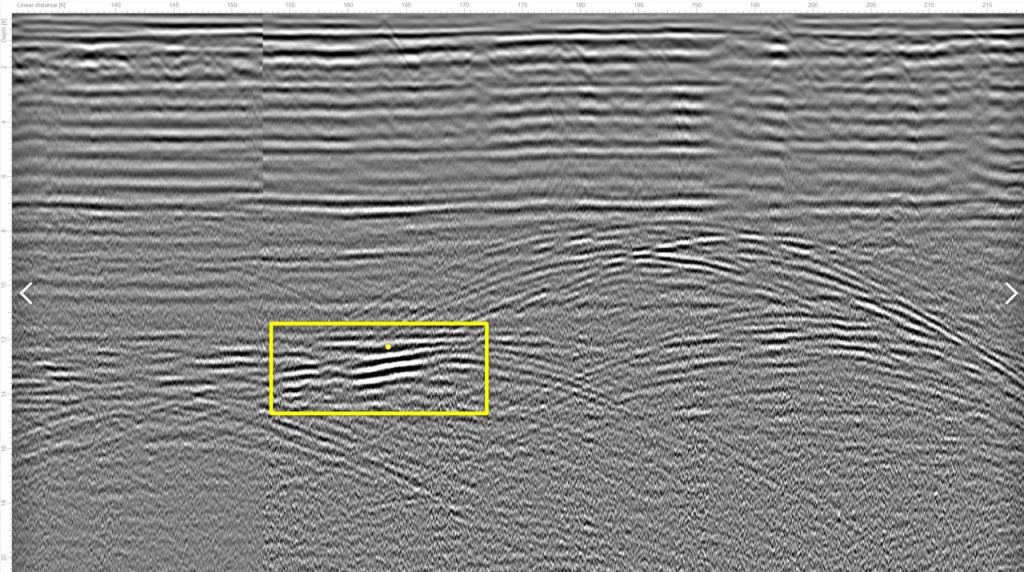
GPR data was mostly as expected, with one are of concern identified across multiple lines. The possible void responses can be seen below highlighted in yellow. Strong reflections like this at depth indicate a relatively large change in dielectric constant. Some other anomalies were seen over the survey area, however they were only seen in single lines as opposed to multiple in those areas leading confidence in them to be low. GPR data was also able to resolve the area of new fill and didn’t see any void responses in the surrounding area.